Impulse Response Tools
Generating Signals for Recording IRs
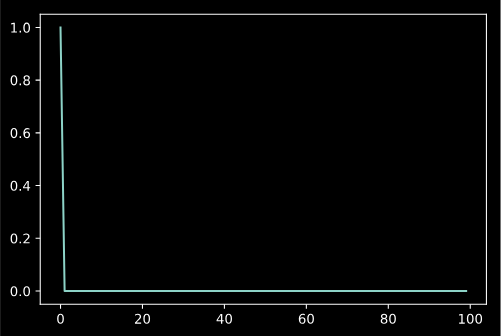
To generate an impulse signal, we can use adsp.impulse().
import audio_dspy as adsp
delta = adsp.impulse(100)

# plot the impulse
import matplotlib.pyplot as plt
plt.plot(delta)
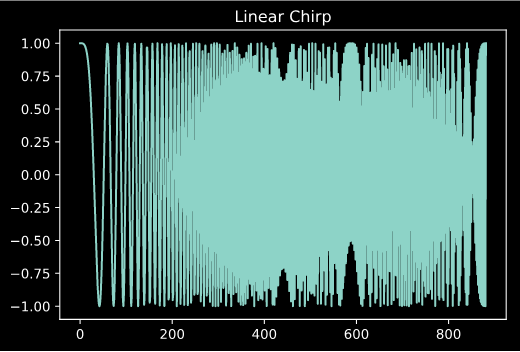
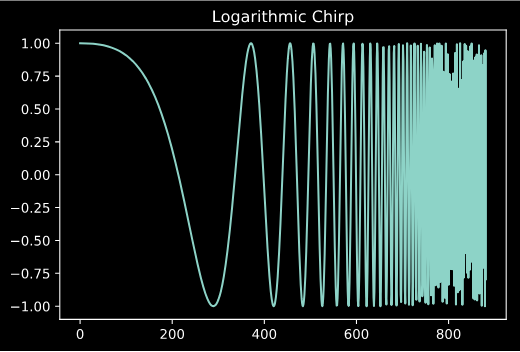
Often a better base signal for recording impulse responses is a sine sweep
or “chirp” signal. Recording IRs with a chirp can result in a significantly
better signal-to-noise ratio than a raw impulse. audio_dspy has
functions for generating both linear and logarithmic chirps.
import audio_dspy as adsp
chirp_lin = adsp.sweep_lin(0.02, 44100)
chirp_log = adsp.sweep_log(20, 20000, 0.02, 44100)

import matplotlib.pyplot as plt
plt.figure()
plt.plot(chirp_lin)
plt.title('Linear Chirp')

plt.figure()
plt.plot(chirp_log)
plt.title('Logarithmic Chirp')
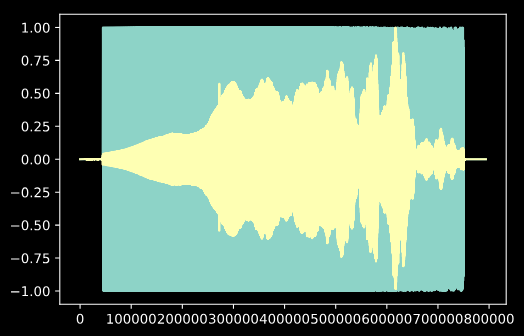
Manipulating a Recorded IR
Now let’s assume that you have generated a sine sweep, and recorded the
sine sweep response of a room. You can now use adsp.sweep2ir()
to convert your recording into an impulse response.
fs, dry_sweep = get_sweep_dry()
import matplotlib.pyplot as plt
fs, sweep = get_sweep_response()
plt.plot(dry_sweep)
plt.plot(sweep)
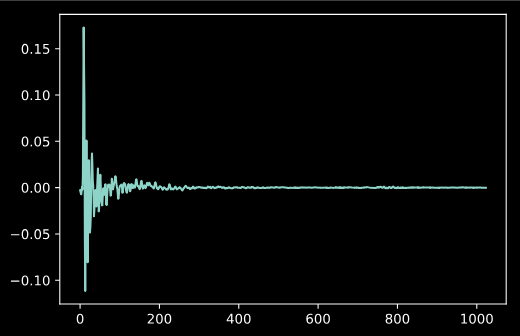
import audio_dspy as adsp
h = adsp.sweep2ir(dry_sweep, sweep)
plt.plot(h[:1024])
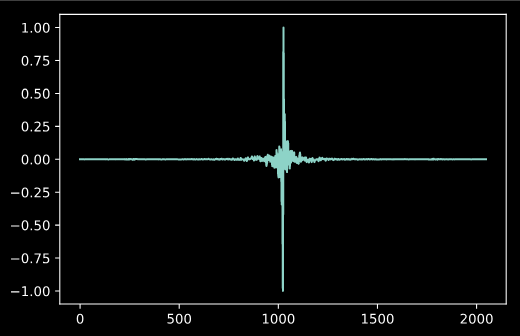
We can now convert this impulse response into a linear phase filter:
h_lin = adsp.tf2linphase(h)
plt.plot(h_lin)
or a minimum phase filter:
h_min = adsp.tf2minphase(h)
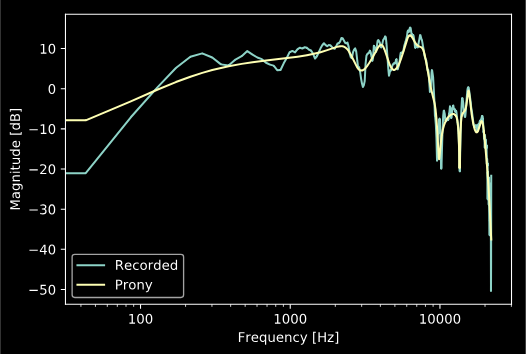
Prony’s Method
audio_dspy also provides functions for creating an IIR filter with an
optimally similar transfer function to the recorded impulse response, using
Prony’s Method.
b, a = adsp.prony(h, 20, 20)
adsp.plot_magnitude_response(h, [1], fs=fs)
adsp.plot_magnitude_response(b, a, fs=fs)

plt.legend(['Recorded', 'Prony'])